NHL 2017 -Official Discussion Thread

User avatar
Montegriffo
Posts: 18718
Joined: Wed Nov 30, 2016 7:14 am

Re: NHL 2017 -Official Discussion Thread

Post by Montegriffo » Tue Feb 06, 2018 3:02 pm

Use and updates

The published table that underpins the D/L method is regularly updated, using source data from more recent matches.

For 50-over matches decided by D/L, each team must face at least 20 overs for the result to be valid. For Twenty20 games decided by D/L, each side must face at least five overs. These minimum limits do not apply to innings where a team is bowled out or reaches its target early. If the conditions prevent a match from reaching this minimum length, it is declared a no result.
1996–2003 – Single version

Until 2003, a single version of D/L was in use. This used a single published reference table of total resource percentages remaining for all possible combinations of overs and wickets,[21] and some simple mathematical calculations, and was relatively transparent and straightforward to implement.

However, a flaw in how it handled very high first innings scores (350+) became apparent from the 1999 Cricket World Cup match in Bristol between India and Kenya. Tony Lewis noticed that there was an inherent weakness in the formula that would give a noticeable advantage to the side chasing a total in excess of 350. A correction was built into the formula and the software, but was not fully adopted until 2004. One-day matches were achieving significantly higher scores than in previous decades, affecting the historical relationship between resources and runs. The second version uses more sophisticated statistical modelling, but does not use a single table of resource percentages. Instead, the percentages also vary with score, so a computer is required.[22] Therefore, it loses some of the previous advantages of transparency and simplicity.

In 2002 the resource percentages were revised, following an extensive analysis of limited overs matches, and there was a change to the G50 for ODIs. (G50 is the average score expected from the team batting first in an uninterrupted 50 overs-per-innings match.) G50 was changed to 235 for ODIs. These changes came into effect on 1 September 2002.[23] As of 2014, these resource percentages are the ones still in use in the Standard Edition, though G50 has subsequently changed.
2004 – Adoption of second version

The original version was named the Standard Edition, and the new version was named the Professional Edition. Tony Lewis said, "We were then [at the time of the 2003 Cricket World Cup Final] using what is now known as the Standard Edition. ... Australia got 359 and that showed up the flaws and straight away the next edition was introduced which handled high scores much better. The par score for India is likely to be much higher now."[26]

Duckworth and Lewis wrote, "When the side batting first score at or below the average for top level cricket ..., the results of applying the Professional Edition are generally similar to those from the Standard Edition. For higher scoring matches, the results start to diverge and the difference increases the higher the first innings total. In effect there is now a different table of resource percentages for every total score in the Team 1 innings."[27] The Professional Edition has been in use in all international one-day cricket matches since early 2004.

The decision on which edition should be used is for the cricket authority which runs the particular competition.[28] The ICC Playing Handbook[29] requires the use of the Professional Edition for internationals.[30] This also applies to most countries' national competitions.[28] At lower levels of the game, where use of a computer cannot always be guaranteed, the Standard Edition is used.[31]
Target score calculations

Using the notation of the ICC Playing Handbook,[29] the team that bats first is called Team 1, their final score is called S, the total resources available to Team 1 for their innings is called R1, the team that bats second is called Team 2, and the total resources available to Team 2 for their innings is called R2.
Percentage total resources remaining reference table (D/L Standard Edition) Overs remaining Wickets in hand
10 8 6 4 2
50 100.0 85.1 62.7 34.9 11.9
40 89.3 77.8 59.5 34.6 11.9
30 75.1 67.3 54.1 33.6 11.9
20 56.6 52.4 44.6 30.8 11.9
10 32.1 30.8 28.3 22.8 11.4
5 17.2 16.8 16.1 14.3 9.4
Step 1. Find the batting resources available to each team

After each reduction in overs, the new total batting resources available to the two teams are found, using figures for the total amount of batting resources remaining for any combination of overs and wickets. While the process for converting these resources remaining figures into total resource available figures is the same in the two Editions, this can be done manually in the Standard Edition, as the resource remaining figures are published in a reference table.[21] However, the resource remaining figures used in the Professional Edition are not publicly available,[9] so a computer must be used which has the software loaded.

If a team loses resource at the start of an innings (left hand image below), then this is simple. For example, if the first 20 overs of an innings are lost, then 30 overs and 10 wickets are remaining, which is 75.1% in the Standard Edition, so this is the resource available.
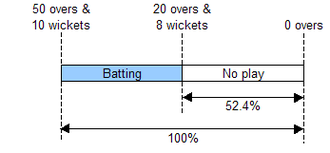
If a team loses resource at the end of its innings (centre image below), then the resource that was available to that team is found by taking the resources it had at the start, and subtracting the resources remaining at the point the innings was ended. For example, if a team starts with 50 overs and 10 wickets (100% of its resources), but its innings is ended with 20 overs and 8 wickets remaining (52.4% of its resources), then the resources it actually used is 100% − 52.4% = 47.6%.
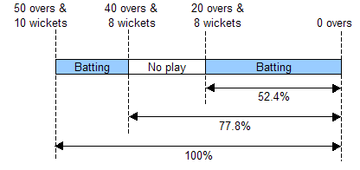
If a team loses resource in the middle of its innings (right hand image below), then the resource that was available to that team is found by taking the resources it had at the start, and subtracting the resources remaining at the point the innings was interrupted (to give the resources used in the first period of the innings), then adding on the resource remaining at the restart. For example, if a team starts with 50 overs and 10 wickets (100% of its resources), but is interrupted when it still has 40 overs and 8 wickets remaining (77.8% of its resources), and restarted when it has 20 overs and 8 wickets remaining (52.4% of its resources), then the resources it actually used is 100% − 77.8% + 52.4% = 74.6%. Another way of looking at this is to say it lost the resources available between 40 overs and 8 wickets (77.8%) and 20 overs and 8 wickets (52.4%), i.e. 77.8% − 52.4% = 25.4%, so its total resource available was 100% − 25.4% = 74.6%.

DuckworthLewisDiag1
Image

Image

Image
These are just the different ways of having one interruption. With multiple interruptions possible, it may seem like finding the total resource percentage requires a different calculation for each different scenario. However, the formula is actually the same each time − it's just that different scenarios, with more or less interruptions and restarts, need to use more or less of the same formula. The total resources available to a team are given by:[21]
Total resources available = 100% − Resources lost by 1st interruption − Resources lost by 2nd interruption − Resources lost by 3rd interruption − ...

which can alternatively be written as:
Total resources available = 100% − Resources remaining at 1st interruption + Resources remaining at 1st restart − Resources remaining at 2nd interruption + Resources remaining at 2nd restart − Resources remaining at 3rd interruption + Resources remaining at 3rd restart − ...

Each time there's an interruption or a restart after an interruption, the resource remaining percentages at those times (obtained from a reference table for the Standard Edition, or from a computer for the Professional Edition) can be entered into the formula, with the rest left blank. Note that a delay at the start of an innings counts as the 1st interruption.
For legal reasons, we are not threatening to destroy U.S. government property with our glorious medieval siege engine. But if we wanted to, we could. But we won’t. But we could.
Image

User avatar
Montegriffo
Posts: 18718
Joined: Wed Nov 30, 2016 7:14 am

Re: NHL 2017 -Official Discussion Thread

Post by Montegriffo » Tue Feb 06, 2018 3:05 pm

Step 2. Convert the two teams' batting resources into Team 2's target score

Standard Edition

If R2 < R1, reduce Team 2's target score in proportion to the reduction in total resources, i.e. S × R2/R1.
If R2 = R1, no adjustment to Team 2's target score is needed.
If R2 > R1, increase Team 2's target score by the extra runs that could be expected to be scored on average with the extra total resource, i.e. S + G50 × (R2 – R1)/100, where G50 is the average 50-over total. Team 2's target score is not simply increased in proportion to the increase in total resources, i.e. S × R2/R1, as this 'could lead to some unrealistically high targets if Team 1 had achieved an early high rate of scoring [in the powerplay overs] and rain caused a drastic reduction in the overs for the match.'[34] Instead, D/L Standard Edition requires average performance for Team 2's additional resource over Team 1.

G50

G50 is the average score expected from the team batting first in an uninterrupted 50 overs-per-innings match. This will vary with the level of competition and over time. The annual ICC Playing Handbook[29] gives the values of G50 to be used each year when the D/L Standard Edition is applied:
Duckworth and Lewis write, 'We accept that the value of G50, perhaps, should be different for each country, or even for each ground, and there is no reason why any cricket authority may not choose the value it believes to be the most appropriate. In fact it would be possible for the two captains to agree a value of G50 before the start of each match, taking account of all relevant factors. However, we do not believe that something that is only invoked if rain interferes with the game should impose itself on every game in this way. In any case, it should be realised that the value of G50 usually has very little effect on the revised target. If 250 were used, for instance, instead of 235, it is unlikely that the target would be more than two or three runs different.'[37]

Professional Edition

If R2 < R1, reduce Team 2's target score in proportion to the reduction in total resources, i.e. S × R2/R1.
If R2 = R1, no adjustment to Team 2's target score is needed.
If R2 > R1, increase Team 2's target score in proportion to the increase in total resources, i.e. S × R2/R1. The problem of early high scoring rates potentially producing anomalously high targets has been overcome in the Professional Edition, which is essentially 'a different table of resource percentages for every total score in the Team 1 innings.'[27] Therefore, Team 2's target score can be simply increased in proportion to the increase in total resources when R2 > R1,[34] and there is no G50.
Example Standard Edition Target score calculations

As the resource percentages used in the Professional Edition are not publicly available, it is difficult to give examples of the D/L calculation for the Professional Edition. Therefore, examples are given from when the Standard Edition was widely used, which was up to early 2004.
Reduced target: Team 1's innings completed; Team 2's innings delayed (i.e. resources lost at the start of the innings)
Percentage total resources remaining reference table (D/L Standard Edition)[21] Overs remaining Wickets in hand
10 8 6 4 2
31 76.7 68.6 54.8 33.7 11.9
30 75.1 67.3 54.1 33.6 11.9
29 73.5 66.1 53.4 33.4 11.9
28 71.8 64.8 52.6 33.2 11.9
27 70.1 63.4 51.8 33.0 11.9
For legal reasons, we are not threatening to destroy U.S. government property with our glorious medieval siege engine. But if we wanted to, we could. But we won’t. But we could.
Image

User avatar
Montegriffo
Posts: 18718
Joined: Wed Nov 30, 2016 7:14 am

Re: NHL 2017 -Official Discussion Thread

Post by Montegriffo » Tue Feb 06, 2018 3:07 pm

Any questions so far?
For legal reasons, we are not threatening to destroy U.S. government property with our glorious medieval siege engine. But if we wanted to, we could. But we won’t. But we could.
Image

K@th
Posts: 3513
Joined: Wed Nov 30, 2016 8:39 am

Re: NHL 2017 -Official Discussion Thread

Post by K@th » Tue Feb 06, 2018 3:09 pm

I have a great recipe for studinina. I was thinking I could put it in the food thread, but this seems so much more appropriate. I'll BBL to enlighten you all.

Image
Account abandoned.

User avatar
Montegriffo
Posts: 18718
Joined: Wed Nov 30, 2016 7:14 am

Re: NHL 2017 -Official Discussion Thread

Post by Montegriffo » Tue Feb 06, 2018 3:10 pm

No questions? Good now we can move on to in game strategy.
In-game strategy
During Team 1's innings
Strategy for Team 1

During Team 1's innings, the target score calculations (as described above), have not yet been made.

The objective of the team batting first is to maximise the target score which will be calculated for the team batting second, which (in the Professional Edition) will be determined by the formula:

Team 2's par score = Team 1's score × Team 2's resources Team 1's resources . {\displaystyle {\text{Team 2's par score }}={\text{ Team 1's score}}\times {\frac {\text{Team 2's resources}}{\text{Team 1's resources}}}.} {\displaystyle {\text{Team 2's par score }}={\text{ Team 1's score}}\times {\frac {\text{Team 2's resources}}{\text{Team 1's resources}}}.}

For these three terms:

Team 1's score: Team 1 will always increase Team 2's target by increasing their own score.
At the start of Team 2's innings, Team 2's resources will be 10 wickets and the number of overs available, and Team 1 cannot affect this.
Team 1's resources are given by:

Total resources available = 100% − Resources lost by 1st interruption − Resources lost by 2nd interruption − Resources lost by 3rd interruption − ...

If there will not be any future interruptions to Team 1's innings, then the amount of resource available to them is now fixed (whether there have been interruptions so far or not), so the only thing Team 1 can do to increase Team 2's target is increase their own score, ignoring how many wickets they lose (as in a normal unaffected match).

However, if there will be future interruptions to Team 1's innings, then an alternative strategy to scoring more runs is minimising the amount of resource they use before the coming interruption (i.e. preserving wickets). While the best overall strategy is obviously to both score more runs and preserve resources, if a choice has to be made between the two, sometimes preserving wickets at the expense of scoring runs ('conservative' batting) is a more effective way of increasing Team 2's target, and sometimes the reverse ('aggressive' batting) is true.
Percentage total resources remaining reference table (D/L Standard Edition)[21] Overs remaining Wickets in hand
10 8 6 4 2
50 100.0 85.1 62.7 34.9 11.9
40 89.3 77.8 59.5 34.6 11.9
30 75.1 67.3 54.1 33.6 11.9
20 56.6 52.4 44.6 30.8 11.9
10 32.1 30.8 28.3 22.8 11.4
5 17.2 16.8 16.1 14.3 9.4

For example, suppose Team 1 has been batting without interruptions, but thinks the innings will be cut short at 40 overs, i.e. with 10 overs left. (Then Team 2 will have 40 overs to bat, so Team 2's resource will be 89.3%.) Team 1 thinks by batting conservatively it can reach 200–6, or by batting aggressively it can reach 220–8:
Batting strategy Conservative Aggressive
Runs Team 1 thinks it can score 200 220
Wickets Team 1 thinks it will have in hand 4 2
Resource remaining to Team 1 at cut-off 22.8% 11.4%
Resource used by Team 1 100% − 22.8% = 77.2% 100% − 11.4% = 88.6%
Team 2's par score 200 x 89.3% / 77.2%
= 231.35 runs 220 x 89.3% / 88.6%
= 221.74 runs

Therefore, in this case, the conservative strategy achieves a higher target for Team 2.
Percentage total resources remaining reference table (D/L Standard Edition)[21] Overs remaining Wickets in hand
10 8 6 4 2
50 100.0 85.1 62.7 34.9 11.9
40 89.3 77.8 59.5 34.6 11.9
30 75.1 67.3 54.1 33.6 11.9
20 56.6 52.4 44.6 30.8 11.9
10 32.1 30.8 28.3 22.8 11.4
5 17.2 16.8 16.1 14.3 9.4

However, suppose instead that the difference between the two strategies is scoring 200–2 or 220–4:
Batting strategy Conservative Aggressive
Runs Team 1 thinks it can score 200 220
Wickets Team 1 thinks it will have in hand 8 6
Resource remaining to Team 1 at cut-off 30.8% 28.3%
Resource used by Team 1 100% − 30.8% = 69.2% 100% − 28.3% = 71.7%
Team 2's par score 200 x 89.3% / 69.2%
= 258.09 runs 220 x 89.3% / 71.7%
= 274.00 runs

In this case, the aggressive strategy is better.

Therefore, the best batting strategy for Team 1 ahead of a coming interruption is not always the same, but varies with the facts of the match situation to date (runs scored, wickets lost, overs used, and whether there have been interruptions), and also with the opinions about what will happen with each strategy (how many further runs will be scored, further wickets will be lost, and further overs will be used? How likely are the coming interruptions, when will they happen, and how long will they last – will Team 1's innings be re-started?).

This example shows just two possible batting strategies, but in reality there could be a range of others, e.g. 'neutral', 'semi-aggressive', 'super-aggressive', or timewasting to minimise the amount of resource used by slowing the over rate. Finding which strategy is the best can only be found by inputting the facts and one's opinions into the calculations and seeing what emerges.

Of course, a chosen strategy may backfire. For example, if Team 1 chooses to bat conservatively, Team 2 may see this and decide to attack (rather than focus on saving runs), and Team 1 may both fail to score many more runs and lose wickets.

Note also that if there have already been interruptions to Team 1's innings, the calculation of total resource they use will be more complicated than this example.
Strategy for Team 2

During Team 1's innings, Team 2's objective is to minimise the target score they will be set. This is achieved by minimising Team 1's score, or (as above), if there will be future interruptions to Team 1's innings, alternatively by maximising the resource used by Team 1 (i.e. wickets lost or overs bowled) before that happens. Team 2 can vary their bowling strategy (between conservative and aggressive) to try and achieve either of these objectives, so this means doing the same calculations as above, inputting their opinions of future runs conceded, wickets taken and overs bowled in each bowling strategy, to see which one is best.

Also, Team 2 can encourage Team 1 to bat particularly conservatively or aggressively (e.g. through field settings).
During Team 2's innings

A target (from a given number of overs) is set for Team 2 at the start of its innings. If there will not be any future interruptions, then both sides can play to a finish in the normal way. However, if there are likely to be interruptions to Team 2's innings, then Team 2 will aim to keep itself ahead of the D/L par score, and Team 1 will aim to keep them behind it. This is because, if a match is abandoned before the given number of overs is complete, Team 2 is declared the winner if they're ahead of the par score, and Team 1 is declared the winner if Team 2 are behind the par score. A tie is declared if Team 2 are exactly on the par score. (This is provided a minimum number of overs has been bowled in Team 2's innings.)

The par score increases with every ball bowled and every wicket lost, as the amount of resource used increases. As an example, in the 2003 Cricket World Cup Final Australia batted first and scored 359 from 50 overs. As Australia completed their 50 overs, their total resources used R1=100%, so India's par score throughout their innings was: 359 x R2/100%, where R2 is the amount of resource used to that point. As shown in the first line of the table below, after 9 overs India were 57-1, and 41 overs and 9 wickets remaining equates to 85.3% of resources, so 100% − 85.3% = 14.7% had been used. India's par score after 9 overs was therefore 359 x 14.7%/100% = 52.773, which is rounded down to 52.

During the six balls of the 10th over India scored 0, 0, 0, 1 (from a no ball), loss of wicket, 0.[51] At the start of the over India were ahead of the par score, but the loss of the wicket caused their par score to jump from 55 to 79, which put them behind the par score.
Overs used 1 wicket lost 2 wickets lost India's actual score
Resources remaining Resources used (R2) D/L par score Resources remaining Resources used (R2) D/L par score
9.0 85.3% 14.7% 52.773 52 78.7% 21.3% 76.467 76 57-1
9.1 85.1% 14.9% 53.491 53 78.5% 21.5% 77.185 77 57-1
9.2 84.9% 15.1% 54.209 54 78.4% 21.6% 77.544 77 57-1
9.3 84.7% 15.3% 54.927 54 78.2% 21.8% 78.262 78 57-1
9.4 84.6% 15.4% 55.286 55 78.1% 21.9% 78.621 78 58-1
9.5 84.4% 15.6% 56.004 56 77.9% 22.1% 79.339 79 58-2
10.0 84.2% 15.8% 56.722 56 77.8% 22.2% 79.698 79
For legal reasons, we are not threatening to destroy U.S. government property with our glorious medieval siege engine. But if we wanted to, we could. But we won’t. But we could.
Image

User avatar
Montegriffo
Posts: 18718
Joined: Wed Nov 30, 2016 7:14 am

Re: NHL 2017 -Official Discussion Thread

Post by Montegriffo » Tue Feb 06, 2018 3:11 pm

Other uses

There are uses of the D/L method other than finding the current official final target score for the team batting second in a match that has already been reduced by the weather.
Ball-by-ball par score
Many stadium scoreboards do not carry information about par scores during games

During the second team's innings, the number of runs a chasing side would expect to have scored on average with this number of overs used and wickets lost, if they were going to successfully match the first team's score, called the D/L par score, may be shown on a computer printout, the scoreboard and/or TV alongside the actual score, and updated after every ball. This can happen in matches which look like they're about to be shortened by the weather, and so D/L is about to be brought into play, or even in matches completely unaffected by the weather. This is:

To help spectators and players understand whether the chasing side are doing better or worse than they would need to do on average to reach the target score.
The score the batting team's score would be compared to determine which side had won, if the match had to be abandoned right then. It is the par score which is displayed, i.e. the score to tie. The target, to win, score is one run more than this. South Africa exited the 2003 World Cup after a resulting a draw with Sri Lanka by mistakenly believing the par score on the printout was the target score.[52][53]

Net run rate calculation

It has been suggested that when a side batting second successfully completes the run chase, the D/L method could be used to predict how many runs they would have scored with a full innings (i.e. 50 overs in a One Day International), and use this prediction in the net run rate calculation.[54]

This suggestion is in response to the criticisms of NRR that it does not take into account wickets lost, and that it unfairly penalizes teams which bat second and win, as those innings are shorter and therefore have less weight in the NRR calculation than other innings which go the full distance.
For legal reasons, we are not threatening to destroy U.S. government property with our glorious medieval siege engine. But if we wanted to, we could. But we won’t. But we could.
Image

User avatar
Montegriffo
Posts: 18718
Joined: Wed Nov 30, 2016 7:14 am

Re: NHL 2017 -Official Discussion Thread

Post by Montegriffo » Tue Feb 06, 2018 3:12 pm

Criticism

The D/L method has been criticized on the grounds that wickets are a much more heavily weighted resource than overs, leading to the suggestion that if teams are chasing big targets, and there is the prospect of rain, a winning strategy could be to not lose wickets and score at what would seem to be a "losing" rate (e.g. if the required rate was 6.1, it could be enough to score at 4.75 an over for the first 20–25 overs).[55] The 2015 update to D/L/S recognised this weakness and changed the rate at which teams needed to score at the start of the second innings in response to a large first innings.

Another criticism is that the D/L method does not account for changes in proportion of the innings for which field restrictions are in place compared to a completed match.[56]

More common informal criticism from cricket fans and journalists of the D/L method is that it is unduly complex and can be misunderstood.[57][58] For example, in a one-day match against England on 20 March 2009, the West Indies coach (John Dyson) called his players in for bad light, believing that his team would win by one run under the D/L method, but not realizing that the loss of a wicket with the last ball had altered the Duckworth–Lewis score. In fact Javagal Srinath, the match referee, confirmed that the West Indies were two runs short of their target, giving the victory to England.

Concerns have been raised as to its suitability for Twenty20 matches, where a high scoring over can drastically alter the situation of the game and variability of the run-rate is higher over matches with a shorter number of overs.[59]
For legal reasons, we are not threatening to destroy U.S. government property with our glorious medieval siege engine. But if we wanted to, we could. But we won’t. But we could.
Image

K@th
Posts: 3513
Joined: Wed Nov 30, 2016 8:39 am

Re: NHL 2017 -Official Discussion Thread

Post by K@th » Tue Feb 06, 2018 3:13 pm

I think the "should kath be a mod thread," is more appropriate for this content, but who am I to squash your free speech?
Account abandoned.

User avatar
Montegriffo
Posts: 18718
Joined: Wed Nov 30, 2016 7:14 am

Re: NHL 2017 -Official Discussion Thread

Post by Montegriffo » Tue Feb 06, 2018 3:15 pm

Cultural influences.
The Duckworth Lewis Method are an Irish pop group formed by Neil Hannon of The Divine Comedy and Thomas Walsh of Pugwash. The Duckworth Lewis Method is also the title of the group's first album, which was released on 3 July 2009, a few days before the start of the 2009 Ashes series. A concept album about cricket, the album has 12 tracks, one of which is an instrumental. The album was mixed and recorded in Dublin and was mastered at Abbey Road Studios.[1]

Hannon and Walsh have described their album as "a kaleidoscopic musical adventure through the beautiful and rather silly world of cricket."[2] The track "Jiggery Pokery" is a comic retelling of the Ball of the Century incident involving Shane Warne and Mike Gatting, and features guest cameo performances from Phill Jupitus, Alexander Armstrong, Matt Berry and more. Berry also features on the track "Mason on the Boundary".

On 9 September 2009 the band were put on hiatus.[3] They wrote and recorded the theme song for the ESPNcricinfo video blog The Two Chucks. In April 2010 The Duckworth Lewis Method album was nominated for an Ivor Novello Award. In an interview with the BBC, Neil Hannon confirmed that he and Thomas Walsh would be working together again in the future.[4]

In late October 2012 Hannon and Walsh confirmed they were working on a second Duckworth Lewis album.[5] Recording sessions began in early 2013 with the intention of releasing the new recording in time for the Ashes series in the summer.[6] In May 2013 the release date for Sticky Wickets was announced. The album came out on 28 June in Ireland and 1 July elsewhere. The release was celebrated with a short concert in Tower Records, Dublin, on 3 July.[7] The album features cameo performances from Stephen Fry, Daniel Radcliffe, Henry Blofeld, and Matt Berry.
For legal reasons, we are not threatening to destroy U.S. government property with our glorious medieval siege engine. But if we wanted to, we could. But we won’t. But we could.
Image

User avatar
Montegriffo
Posts: 18718
Joined: Wed Nov 30, 2016 7:14 am

Re: NHL 2017 -Official Discussion Thread

Post by Montegriffo » Tue Feb 06, 2018 3:16 pm

Kath wrote:I think the "should kath be a mod thread," is more appropriate for this content, but who am I to squash your free speech?
Hey it's a free for all now. Liberty has been established.
Take no prisoners.
For legal reasons, we are not threatening to destroy U.S. government property with our glorious medieval siege engine. But if we wanted to, we could. But we won’t. But we could.
Image